6.2.7.1 The Color Balance Tool
Figure
6.25(a)
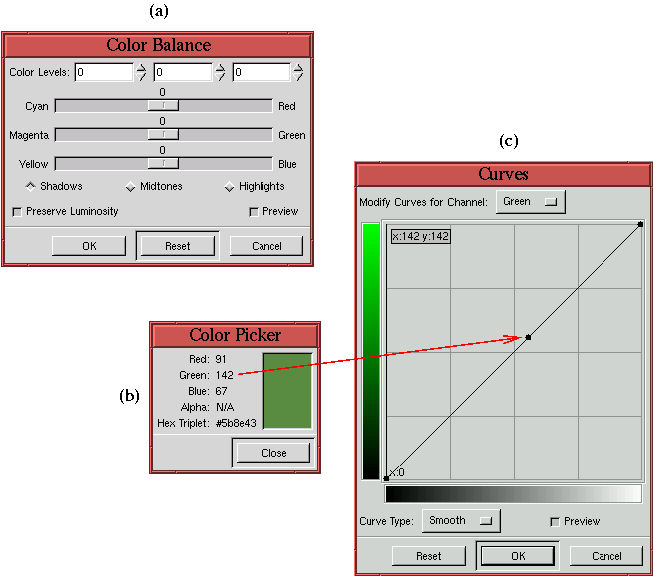
Figure 6.25:
Comparing Color Balance to the Curves Tool
 |
shows the dialog for the
Color Balance tool. This allows an
image to be adjusted in the shadow, midtone, or highlight regions for
the red-cyan, green-magenta, or blue-yellow balance.
Curves
does exactly the same thing except with much greater precision.
Raising a curve at a point adds more of the color it represents at the
expense of the complementary color around that point. Lowering the
curve has the opposite effect, that of shifting the balance towards
the complementary color.
The Curves tool can do anything the Color Balance tool
can, but better. The reason Curves is more powerful is that the
Color Picker can be used to identify exactly which input values
need color balancing. The Color Picker
is shown in Figure
6.25(b), and it is
displaying a value for a measured pixel in an image. This value can
be precisely placed and manipulated in the Curves tool.
Figure
6.25(c) shows how a control point,
corresponding to the green component of the measured pixel, has been
placed on the Green channel curve. This placement of a control point,
corresponding to a measured pixel value, permits the subsequent,
precise correction of color balance at this point. By comparison, the
Color Balance tool only allows for the gross selection of input
regions (shadow, midtone, and highlight) and is incapable of
performing the precision color corrections described in detail in
Section
6.2.2.
The conclusion is that the Curves tool is much more precise and
versatile than the Color Balance tool.
