6.2.7.2 The Brightness-Contrast Tool
Figure
6.26(a)
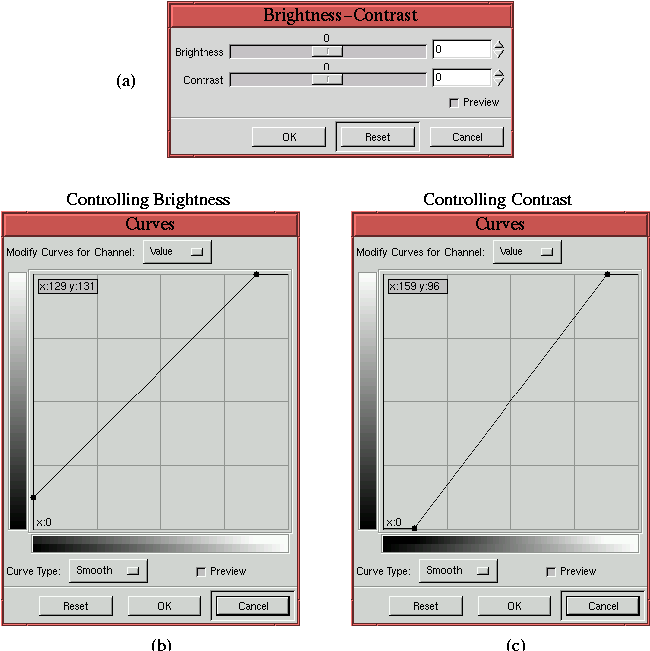
Figure 6.26:
Comparing Brightness-Contrast with the Curves Tool
 |
displays the dialog for the
Brightness-Contrast tool. The way
this tool functions can be fully simulated using the
Curves
tool. Figure
6.26(b) illustrates the
Value channel of the
Curves tool, showing that the curve has
been displaced upward. Moving the value curve up maps the input value
domain to an output range that is uniformly brighter. This
modification to the value curve exactly simulates the action of the
Brightness-Contrast tool when the Brightness slider in the
dialog is moved to the right. Moving the Brightness slider to the
left corresponds to displacing the value curve downward.
Thus, brightening or darkening an image using the Brightness slider
has the effect of diminishing tonal range because the result maps the
input value domain to a smaller output range. From the discussion in
Section
6.1, this is clearly a disadvantage. The
Curves tool, on the other hand, can be used to increase or
decrease brightness without loosing tonal range. To brighten an image
place a control point on the Value curve and displace the point
upwards. This brightens the image without losing tonal range. To
darken the image drag the point downwards.
Figure
6.26(c) also shows the Value
channel of the Curves tool. Here, the curve has been rotated
counter-clockwise around the center of the input-output dialog. This
has the effect of increasing contrast in the midtones of the image.
However, it simultaneously eliminates detail in the shadow and
highlight ranges. This action is exactly what the Brightness-Contrast tool does when the Contrast slider of the dialog
is moved to the right. Moving the slider to the left corresponds to
rotating the curve in the clockwise direction.
The conclusion is that the Curves tool performs much better than
the Brightness-Contrast tool.
