6.2.2 Color Correcting by Balancing the Neutrals
A powerful method for identifying color casts is to measure the color
of pixels that, in principle, should be neutral gray. Neutrals must
have equal components of red, green, and blue. If they don't, that
indicates the presence of a color cast, and you know that a color
correction must be made.
Figure
6.13
Figure 6.13:
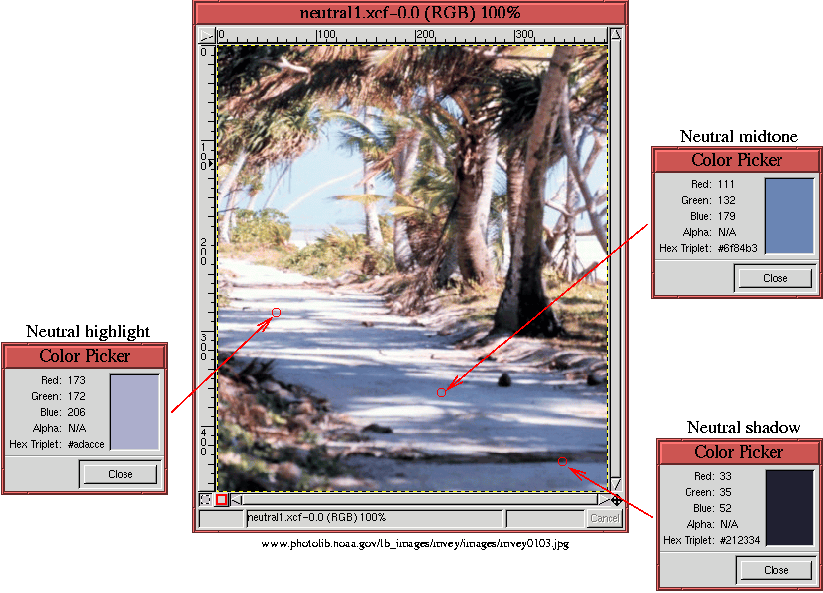
Image with a Color Cast? The Measured Pixels Say Yes!
 |
illustrates a case where the identification of neutral pixels allows
us to color correct the image. In the image, the arcade of palm trees
casts shadows over a white sand path and, in principle these shadows
should be neutral in color.
There are a wide range of values for the shadow along the path, and it
is possible to measure dark, mid-range, and light shadow values. In
Figure
6.13, these are referred to as shadow,
midtone, and highlight neutrals, and their values, measured with the
Color Picker, are shown at three
different points. (The Color Picker is located in the Toolbox
and is represented by the eye-dropper icon.) Measuring color in an
image with the Color Picker displays the color in a rectangular
patch in the Color Picker dialog and gives its R, G, and B
values. Measuring a color with the Color Picker also has the
effect of setting the Active Foreground Color patch, in the
Toolbox window, to the measured color.
For the three measured pixels shown in
Figure
6.13, you can see that there is a distinct
blue tinge for each one. Not only do the color patches shown in the
Color Picker dialog look blue, the measured R, G, and B values
show that there is a significant deviation of the blue values from the
red and green ones--too much for the color of these pixels to be
neutral. Using the color notation introduced in
Section
5.1, the color patches shown in the Color Picker dialogs have the values
33R 35G 52B for the shadow,
111R 132G 179B for the midtone, and
173R 172G 206B for the
highlight. The measured R, G, and B values for each point clearly
indicate that there is too much blue.
It is true that shadows sometimes appear blue. However, this is
usually true in winter away from the equator and is due to the natural
filtering of the sun's rays by the earth's atmosphere. The blue color
cast measured in Figure
6.13 is more likely due to
the tendency of film, especially slide film, to produce blue casts
when photographing under natural sky light. In any case, at an
equatorial location on the earth, we would expect the fuller spectrum
of the sun's light to create neutral shadows when these are seen on a
neutral background.
In addition to the blue cast, there may also be a slight red
deficiency in the midtone range. In the following discussion the blue
color cast and the red midtone deficiency are corrected using the Curves tool.
Figures
6.14
Figure 6.14:
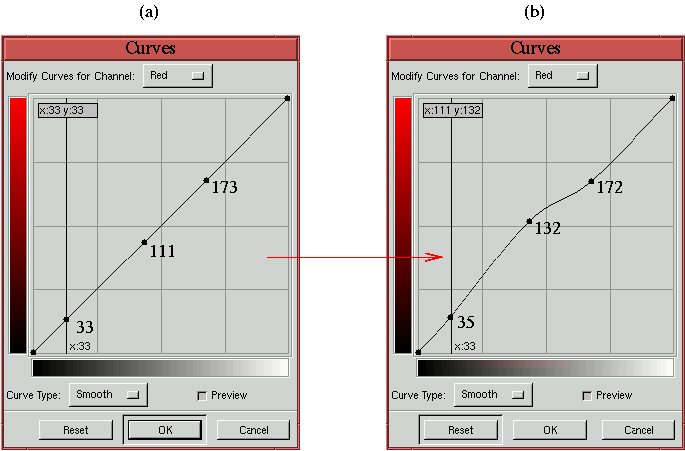
Using the Measured Pixel Values to Modify the Red Curve
 |
and
6.15
Figure 6.15:
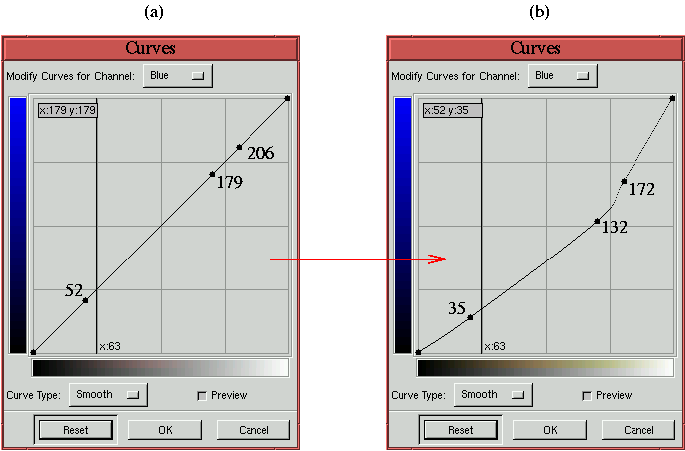
Using the Measured Pixel Values to Modify the Blue Curve
 |
illustrate how the
Curves tool is used to correct these color
problems. Figure
6.14 shows a modification to the
red curve and Figure
6.15 to the blue. For each,
the procedure is identical. The red and blue components of the
measured pixel values are used to place control points on their
respective curves. This is shown in part (a) of each figure. The
accurate placement of the points is facilitated by the Information
Field found in the upper left corner of the graph area. The control
points are then moved vertically up or down to new positions, which
remaps the ranges of pixel values between them and makes the measured
pixels neutral in value. The displaced control points are shown in
part (b) of the figures.
Again, the goal in displacing the control points is to make each of
the measured pixel values neutral. This means making their red,
green, and blue components equal. In this example, this is
accomplished by moving the red and blue control points so that their
values are made equal to the measured green values. The accurate
repositioning of the points is made possible by the position
Information Field displayed in the upper-left corner of the graph
area. Note that the numbers positioned near the control points in
Figures
6.14 and
6.15 are not a feature of the Curves tool;
they are placed there to clarify the procedure.
Thus, on the red control curve, the shadow, midtone, and highlight
values are moved from 33, 111, and 173 to the measured green values of
35, 132, and 172. On the blue control curve, the shadow, midtone, and
highlight values are moved from 52, 179, and 206, again, to the green
values of 35, 132, and 172. After the operation, the color values for
the three measured pixels are
35R 35G 35B for the shadow,
132R
132G 132B for the midtone, and
172R 172G 172B for the
highlight--all three neutral grays.
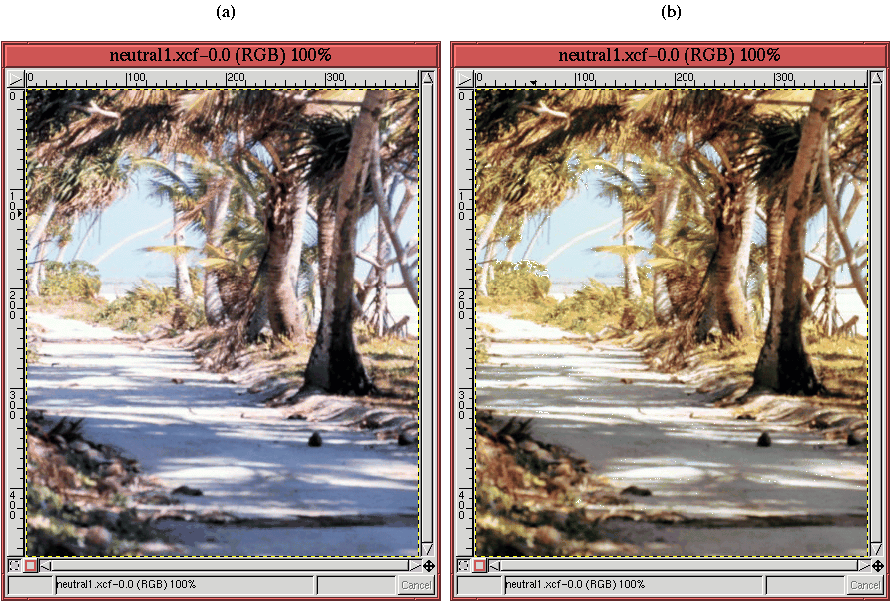
The result of color correcting the neutral pixel values is shown in
Figure
6.16(b).
Figure 6.16:
Comparison of the Original and Color Corrected Images
 |
For comparison, the original image is shown in
Figure
6.16(a). It is quite clear now that the
original image did have a blue cast and that this has been eliminated
in the corrected image. Measuring the pixel values along the
tree-lined path shows that, overall, the balance is much better and
most of the tree shadow values are now neutral. Furthermore, the rest
of the image has taken on a much warmer look. The trees are now
bathed in a yellow light, corresponding better to what we might expect
from a tropical sunlit scene.
There are some practical questions about the color correcting
procedure just described. The first is, why were the blue and red
channels matched to the green? For the three measured pixels there
are a total of nine ways to make the three neutral. However, in
practice, it is typical that two of the channels are almost the same
and that one is quite different. When this is the case, as it is for
the the measured shadow and highlight values in the preceding example,
the choice is clear. When it is not the case, some experimentation
may be necessary.
The second question about the procedure is, why measure three points?
The method doesn't require three points and, amazingly, often a single
point can suffice to color correct the entire image. However,
matching a shadow, midtone, and highlight image point provides
additional insurance that the color in each range is properly
balanced.
The Curves tool has several features that facilitate the
positioning of points on the control curves. Clicking the mouse
button in the image window produces a vertical bar in the graph area
of the Curves tool. The bar position corresponds to the pixel
value the mouse cursor is over in the image window. Clicking and
dragging the mouse button interactively updates the position of the
vertical bar. In this way, it is possible to see where different
pixel values in the image are located on the control curve and helps
to discover the locations of shadow, midtone, and highlight pixels.
In addition to input position information, Shift-clicking in the image
window automatically creates a control point on the curve in the
active channel of the Curves dialog. Control-clicking on a
point in the image window produces control points on each of the Red,
Green, Blue, and Value control curves.
In addition to the Curves tool features, a very useful tool for
exploring and discovering color problems in an image is the Info
Window dialog.
This dialog is found in the Image:View menu and can also be
invoked by typing C-S-i in the image window. The Extended tab
of this dialog interactively reports the R, G, and B pixel-color
components when the mouse is in the image window. The advantage of
the Info Window over the Color Picker for measuring pixel values in the image window is it remains
open while using the Curves tool.
There are two lessons to be learned from this section. First, color
correction can be very easy. Measuring only a few pixel values across
the shadow to highlight range can color correct an entire image in a
few minutes time. Second, the color correction obtained in this way
not only fixes the individual measured pixels but usually corrects the
entire image. Third, the Curves tool is the only one which can
be used to correct the image based on measured pixel values. For
these reasons, the Curves tool is the most precise and the most
powerful tool for color correction in the GIMP.
