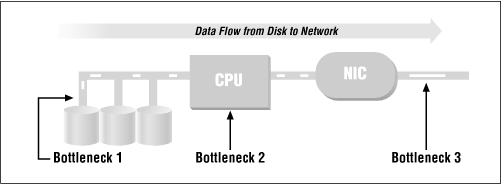
From the information above we can work out a model that will tell us the maximum capability of a given machine. The data is mostly taken from Brian Wong's
Configuration and Capacity Planning for Solaris Servers,
[] so there is a slight Sun bias to our examples.
A word of warning: this is not a complete model. Don't assume that this model will predict every bottleneck or even be within 10 percent in its estimates. A model to predict performance instead of one to warn you of bottlenecks would be much more complex and would contain rules like "not more than three disks per SCSI chain". (A good book on real models is Raj Jain's
The Art of Computer Systems Performance Analysis.[]) With that warning, we present the system in
Figure B.2.

The flow of data should be obvious. For example, on a read, data flows from the disk, across the bus, through or past the CPU, and to the network interface card (NIC). It is then broken up into packets and sent across the network. Our strategy here is to follow the data through the system and see what bottlenecks will choke it off. Believe it or not, it's rather easy to make a set of tables that list the maximum performance of common disks, CPUs, and network cards on a system. So that's exactly what we're going to do.
Let's take a concrete example: a Linux Pentium 133 MHz machine with a single 7200 RPM data disk, a PCI bus, and a 10-Mb/s Ethernet card. This is a perfectly reasonable server. We start with
Table B.2, which describes the hard drive - the first potential bottleneck in the system.
Disk throughput is the number of kilobytes of data that a disk can transfer per second. It is computed from the number of 8KB I/O operations per second a disk can perform, which in turn is strongly influenced by disk RPM and bit density. In effect, the question is: how much data can pass below the drive heads in one second? With a single 7200 RPM disk, the example server will give us 70 I/O operations per second at roughly 560KB/s.
The second possible bottleneck is the CPU. The data doesn't actually flow through the CPU on any modern machines, so we have to compute throughput somewhat indirectly.
The CPU has to issue I/O requests and handle the interrupts coming back, then transfer the data across the bus to the network card. From much past experimentation, we know that the overhead that dominates the processing is consistently in the filesystem code, so we can ignore the other software being run. We compute the throughput by just multiplying the (measured) number of file I/O operations per second that a CPU can process by the same 8K average request size. This gives us the results shown in
Table B.3.
Table B.3: CPU Throughput
|
CPU |
I/O Operations/second |
KB/second |
|
Intel Pentium 133 |
700
|
5,600
|
|
Dual Pentium 133 |
1,200
|
9,600
|
|
Sun SPARC II |
660
|
5,280
|
|
Sun SPARC 10 |
750
|
6,000
|
|
Sun Ultra 200 |
2,650
|
21,200
|
Now we put the disk and the CPU together: in the Linux example, we have a single 7200 RPM disk, which can give us 560KB/s, and a CPU capable of starting 700 I/O operations, which could give us 5600KB/s. So far, as you would expect, our bottleneck is clearly going to be the hard disk.
The last potential bottleneck is the network. If the network speed is below 100 Mb/s, the bottleneck will be the network speed. After that, the design of the network card is more likely to slow us down.
Table B.4 shows us the average throughput of many types of data networks. Although network speed is conventionally measured in bits per second,
Table B.4 lists bytes per second to make comparison with the disk and CPU (
Table B.2 and
Table B.3) easier.
Table B.4: Network Throughput
|
Network Type |
KB/second |
|
ISDN |
16 |
|
T1 |
197 |
|
Ethernet 10m |
1,113 |
|
Token ring |
1,500 |
|
FDDI |
6,250 |
|
Ethernet 100m |
6,500[] |
|
ATM 155 |
7,125a |
In the running example, we have a bottleneck at 560KB/s due to the disk.
Table B.4 shows us that a standard 10 megabit per second Ethernet (1,113KB/s) is far faster than the disk. Therefore, the hard disk is still the limiting factor. (This scenario, by the way, is very common.) Just by looking at the tables, we can predict that small servers won't have CPU problems, and that large ones with multiple CPUs will support striping and multiple Ethernets long before they start running out of CPU power. This, in fact, is exactly what happens.
