Before you learn how to configure your system, you should learn how to gather essential system information. For example, you should know how to find the amount of free memory, the amount of available hard drive space, how your hard drive is partitioned,
and what processes are running. This chapter discusses how to retrieve this type of information from your Red Hat Enterprise Linux system using simple commands and a few simple programs.
The ps ax command displays a list of current system processes, including processes owned by other users. To display the owner alongside each process, use the ps
aux command. This list is a static list; in other words, it is a snapshot of what was running when you invoked the command. If you want a constantly updated list of running processes, use top as described below.
The ps output can be long. To prevent it from scrolling off the screen, you can pipe it through less:
ps aux | less
You can use the ps command in combination with the grep command to see if a process is running. For example, to determine if Emacs is
running, use the following command:
ps ax | grep emacs
The top command displays currently running processes and important information about them including their memory and CPU usage. The list is both real-time and interactive. An example of output from the
top command is provided as follows:
top - 15:02:46 up 35 min,  4 users,  load average: 0.17, 0.65, 1.00
Tasks: 110 total,   1 running, 107 sleeping,   0 stopped,   2 zombie
Cpu(s): 41.1% us,  2.0% sy,  0.0% ni, 56.6% id,  0.0% wa,  0.3% hi,  0.0% si
Mem:    775024k total,   772028k used,     2996k free,    68468k buffers
Swap:  1048568k total,      176k used,  1048392k free,   441172k cached

  PID USER      PR  NI  VIRT  RES  SHR S %CPU %MEM    TIME+  COMMAND
 4624 root      15   0 40192  18m 7228 S 28.4  2.4   1:23.21 X
 4926 mhideo    15   0 55564  33m 9784 S 13.5  4.4   0:25.96 gnome-terminal
 6475 mhideo    16   0  3612  968  760 R  0.7  0.1   0:00.11 top
 4920 mhideo    15   0 20872  10m 7808 S  0.3  1.4   0:01.61 wnck-applet
    1 root      16   0  1732  548  472 S  0.0  0.1   0:00.23 init
    2 root      34  19     0    0    0 S  0.0  0.0   0:00.00 ksoftirqd/0
    3 root       5 -10     0    0    0 S  0.0  0.0   0:00.03 events/0
    4 root       6 -10     0    0    0 S  0.0  0.0   0:00.02 khelper
    5 root       5 -10     0    0    0 S  0.0  0.0   0:00.00 kacpid
   29 root       5 -10     0    0    0 S  0.0  0.0   0:00.00 kblockd/0
   47 root      16   0     0    0    0 S  0.0  0.0   0:01.74 pdflush
   50 root      11 -10     0    0    0 S  0.0  0.0   0:00.00 aio/0
   30 root      15   0     0    0    0 S  0.0  0.0   0:00.05 khubd
   49 root      16   0     0    0    0 S  0.0  0.0   0:01.44 kswapd0
To exit top, press the q key.
Table 37.1, “Interactive top commands” contains useful interactive commands that you can use with top. For more information, refer to the top(1) manual page.
|
Command
|
Description
|
|
Space
|
Immediately refresh the display
|
|
h
|
Display a help screen
|
|
k
|
Kill a process. You are prompted for the process ID and the signal to send to it.
|
|
n
|
Change the number of processes displayed. You are prompted to enter the number.
|
|
u
|
Sort by user.
|
|
M
|
Sort by memory usage.
|
|
P
|
Sort by CPU usage.
|
Table 37.1. Interactive top commands
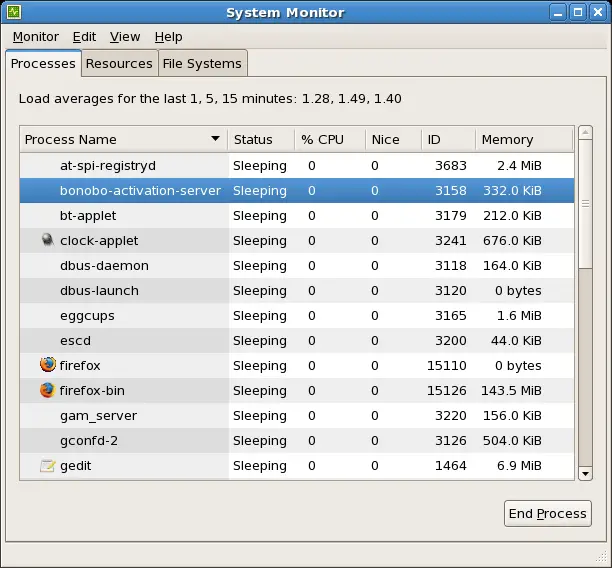
If you prefer a graphical interface for top, you can use the GNOME System Monitor. To start it from the desktop, select => => or type gnome-system-monitor at a shell prompt (such as an XTerm).
Select the Process Listing tab.
The GNOME System Monitor allows you to search for a process in the list of running processes. Using the Gnome System Monitor, you can also view all processes, your processes, or active processes.
The menu item allows you to:
-
Stop a process.
-
Continue or start a process.
-
End a processes.
-
Kill a process.
-
Change the priority of a selected process.
-
Edit the System Monitor preferences. These include changing the interval seconds to refresh the list and selecting process fields to display in the System Monitor window.
The menu item allows you to:
-
View only active processes.
-
View all processes.
-
View my processes.
-
View process dependencies.
-
Hide a process.
-
View hidden processes.
-
View memory maps.
-
View the files opened by the selected process.
To stop a process, select it and click End Process. Alternatively you can also stop a process by selecting it, clicking on your menu and selecting .
To sort the information by a specific column, click on the name of the column. This sorts the information by the selected column in ascending order. Click on the name of the column again to toggle the sort between ascending and descending order.