Compilation and Instrumentation
When you write traditional programs in Solaris, you use a compiler to convert
your program from source code into object code that you can execute. When
you use the dtrace command you are invoking the compiler for the D
language used earlier to write the hello.d program. Once your program is compiled,
it is sent into the operating system kernel for execution by DTrace. There
the probes that are named in your program are enabled and the corresponding
provider performs whatever instrumentation is needed to activate them.
All of the instrumentation in DTrace is completely dynamic: probes are enabled discretely
only when you are using them. No instrumented code is present for inactive
probes, so your system does not experience any kind of performance degradation when
you are not using DTrace. Once your experiment is complete and the dtrace
command exits, all of the probes you used are automatically disabled and their
instrumentation is removed, returning your system to its exact original state. No effective
difference exists between a system where DTrace is not active and one where
the DTrace software is not installed.
The instrumentation for each probe is performed dynamically on the live running operating
system or on user processes you select. The system is not quiesced or
paused in any way, and instrumentation code is added only for the probes
that you enable. As a result, the probe effect of using DTrace is
limited to exactly what you ask DTrace to do: no extraneous data
is traced, no one big “tracing switch” is turned on in the system,
and all of the DTrace instrumentation is designed to be as efficient as
possible. These features enable you to use DTrace in production to solve real
problems in real time.
The DTrace framework also provides support for an arbitrary number of virtual clients.
You can run as many simultaneous DTrace experiments and commands as you like,
limited only by your system's memory capacity, and the commands all operate independently
using the same underlying instrumentation. This same capability also permits any number of
distinct users on the system to take advantage of DTrace simultaneously: developers, administrators,
and service personnel can all work together or on distinct problems on the
same system using DTrace without interfering with one another.
Unlike programs written in C and C++ and similar to programs written in
the JavaTM programming language, DTrace D programs are compiled into a safe intermediate
form that is used for execution when your probes fire. This intermediate form
is validated for safety when your program is first examined by the DTrace
kernel software. The DTrace execution environment also handles any run-time errors that might
occur during your D program's execution, including dividing by zero, dereferencing invalid memory, and
so on, and reports them to you. As a result, you can
never construct an unsafe program that would cause DTrace to inadvertently damage the
Solaris kernel or one of the processes running on your system. These safety
features allow you to use DTrace in a production environment without worrying about crashing
or corrupting your system. If you make a programming mistake, DTrace will report
your error to you, disable your instrumentation, and you can correct your mistake
and try again. The DTrace error reporting and debugging features are described later
in this book.
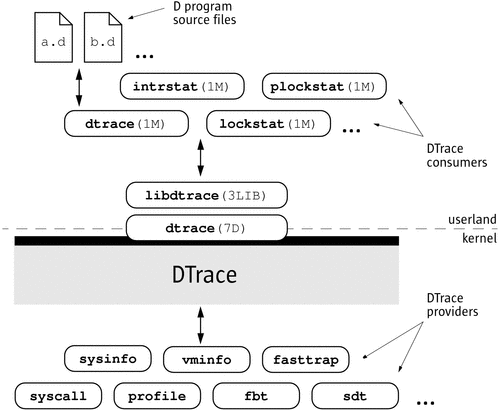
The following diagram shows the different components of the DTrace architecture, including providers,
probes, the DTrace kernel software, and the dtrace command.
Figure 1-1 Overview of the DTrace Architecture and Components
Now that you understand how DTrace works, let's return to the tour
of the D programming language and start writing some more interesting programs.