Until now we have assumed that the layout of the DataPilot contains only one data field. However, it is possible to have several data fields in the middle of the layout. This makes summaries and analyses of multiple aspects possible.
You could, for example, list all the sales values per day and additionally give the number of entries per day.
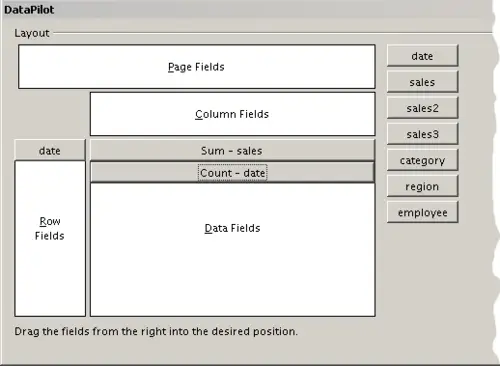
Multiple data fields in the DataPilot
For this, in addition to the sales field, add the date field into the Data Fields area. For the date field, choose the Count option for the aggregate function.
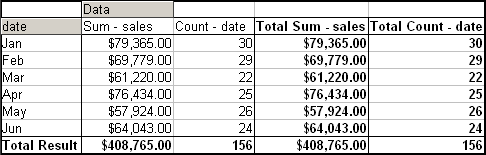
Since every entry has a specific date, this field will give you the number of entries for each date. If you group the values per month, you get an overview with the sales value and the number of closed sales for each category and month.
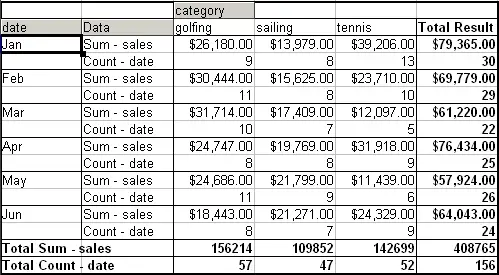
DataPilot shows sales value and number of entries
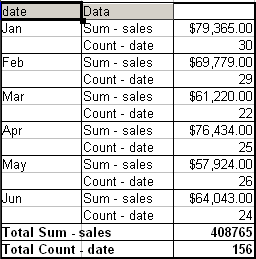
For manipulating the existing data fields, DataPilot result contains a field called Data. You can move it just like row or column fields by using drag and drop. This is an easy way to archive a different structure for the results.
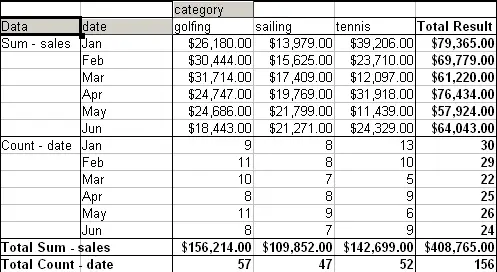
Layout option for presenting the sums and numbers of the sales values
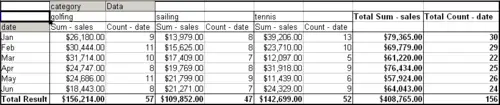
Another layout option for presenting the sums and numbers of the sales values
If you want to put the different data fields in different columns and your DataPilot does not contain another column field or you sort the different data fields in different rows and don’t have another row field, then it is useful to disable the view of the row or column sums
Unnessecary columns
Disabled column sums
A frequent use case for multiple data fields is the aggregation of one value according to different aggregate functions at the same time. You can create a DataPilot that shows you the monthly sales values and shows you additionally the smallest and the biggest amount.
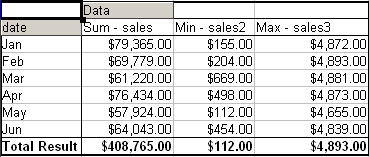
Multiple analyses for the same data field
Unfortunately, Calc does not allow you to use the same data field multiple times. For such multiple analyses you have to duplicate in the source the respective column. This column is then available within the DataPilot; it just happens to have identical values.
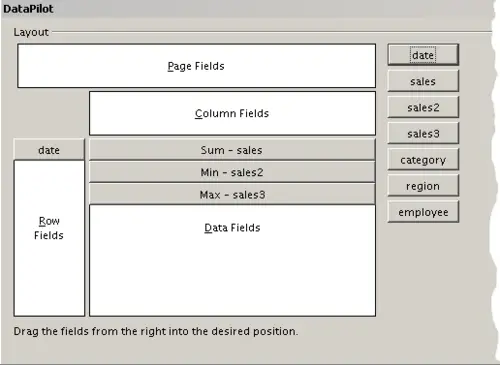
Multiple identical fields for sales value, that have been created as duplicates within your source.


