The Format menu has many options for formatting and fine-tuning the appearance of your charts.
Double-click the chart so that it is enclosed by a gray border indicating edit mode. Click Format in the main menu.
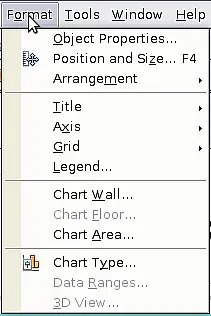
Chart format menu
- Object Properties opens a dialog in which you can specify the area fill, borders, transparency, characters, font effects, and other attributes of the selected element of the chart (see page 23).
- Position and Size opens a dialog (see
Using the Position and Size dialog).
- Arrangement provides two choices: Bring Forward and Send Backward, of which only one may be active for some items. Use these choices to arrange overlapping data series.
- Title formats the titles of the chart and its axes.
- Axis formats the lines that create the chart as well as the font of the text that appears on both the X and Y axes.
- Grid formats the lines that create a grid for the chart.
- Legend formats the location, borders, background, and type of the legend.
- Chart Wall, Chart Floor, and Chart Area are described in the following sections.
- Chart Type changes what kind of chart is displayed and whether it is two- or three-dimensional.
- 3D View formats 3D charts.
 | Chart Floor and 3D View are only available for a 3D chart. These options are unavailable (grayed out) if a 2D chart is selected.
|
In most cases you need to make sure to select the exact element you want to format. Sometimes this can be tricky to do with the mouse, if the chart has many elements, especially if some of them are small or overlapping. If you have Tooltips turned on, then as you move the mouse over each element, its name appears in the tooltip. Once you have selected one element, you can press Tab to move through the other elements until you find the one you want. The name of the selected element appears in the Status Bar.


