The expert infos is a kind of log of the anomalies found
by Wireshark in a capture file.
The general idea behind the following "Expert Info" is to
have a better display of "uncommon" or just notable network
behaviour. This way, both novice and expert users will
hopefully find probable network problems a lot faster, compared
to scanning the packet list "manually" .
Expert infos are only a hint!
Take expert infos as a hint what's worth looking at,
but not more. For example: The absence of expert infos
doesn't necessarily mean everything is ok!
The amount of expert infos largely depends on the
protocol being used!
While some common protocols like TCP/IP will show
detailed expert infos, most other protocols currently won't
show any expert infos at all.
The following will first describe the components of a
single expert info, then the User Interface.
7.3.1. Expert Info Entries
Each expert info will contain the following things
which will be described in detail below:
Table 7.1. Some example expert infos
Packet #
Severity
Group
Protocol
Summary
1
Note
Sequence
TCP
Duplicate ACK (#1)
2
Chat
Sequence
TCP
Connection reset (RST)
8
Note
Sequence
TCP
Keep-Alive
9
Warn
Sequence
TCP
Fast retransmission (suspected)
7.3.1.1. Severity
Every expert info has a specific severity level. The
following severity levels are used, in parentheses are the
colors in which the items will be marked in the GUI:
Chat (grey): information about usual
workflow, e.g. a TCP packet with the SYN flag
set
Note (cyan): notable things, e.g. an
application returned an "usual" error code like HTTP
404
Warn (yellow): warning, e.g.
application returned an "unusual" error code like a
connection problem
Error (red): serious problem, e.g.
[Malformed Packet]
7.3.1.2. Group
There are some common groups of expert infos. The
following are currently implemented:
Checksum: a checksum was
invalid
Sequence: protocol sequence
suspicious, e.g. sequence wasn't continuous or a
retransmission was detected or ...
Response Code: problem with
application response code, e.g. HTTP 404 page not
found
Request Code: an application request
(e.g. File Handle == x), usually Chat level
Undecoded: dissector incomplete or
data can't be decoded for other reasons
Reassemble: problems while
reassembling, e.g. not all fragments were available or
an exception happened while reassembling
Malformed: malformed packet or
dissector has a bug, dissection of this packet
aborted
Debug: debugging (should not occur in
release versions)
It's possible that more such group values
will be added in the future ...
7.3.1.3. Protocol
The protocol in which the expert info was
caused.
7.3.1.4. Summary
Each expert info will also have a short additional
text with some further explanation.
7.3.2. "Expert Info Composite" dialog
From the main menu you can open the expert info dialog,
using: "Analyze/Expert Info Composite"
XXX - "Analyze/Expert Info" also exists but is
subject to removal and therefore not explained here.
XXX - add explanation of the dialogs context
menu.
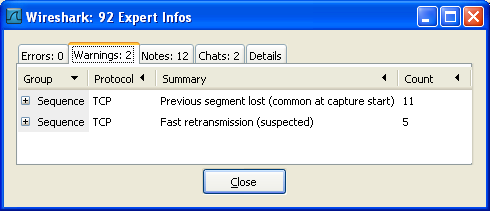
7.3.2.1. Errors / Warnings / Notes / Chats tabs
An easy and quick way to find the most interesting
infos (rather than using the Details tab), is to have a look at the
separate tabs for each severity level. As the tab label
also contains the number of existing entries, it's easy to
find the tab with the most important entries.
There are usually a lot of identical expert infos
only differing in the packet number. These identical infos
will be combined into a single line - with a count column
showing how often they appeared in the capture file. Clicking on
the plus sign shows the individual packet numbers in a tree
view.
7.3.2.2. Details tab
The Details tab provides the expert infos in a "log
like" view, each entry on its own line (much like the
packet list). As the amount of expert infos for a capture
file can easily become very large, getting an idea of the
interesting infos with this view can take quite a while.
The advantage of this tab is to have all entries in the
sequence as they appeared, this is sometimes a help to
pinpoint problems.
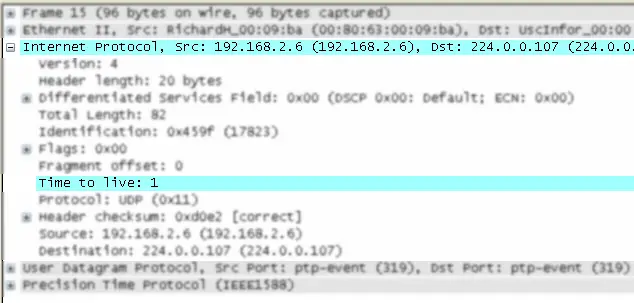
7.3.3. "Colorized" Protocol Details Tree
The protocol field causing an expert info is colorized,
e.g. uses a cyan background for a note severity level. This
color is propagated to the toplevel protocol item in the
tree, so it's easy to find the field that caused the expert
info.
For the example screenshot above, the IP "Time to live"
value is very low (only 1), so the corresponding protocol
field is marked with a cyan background. To easier find that
item in the packet tree, the IP protocol toplevel item is
marked cyan as well.
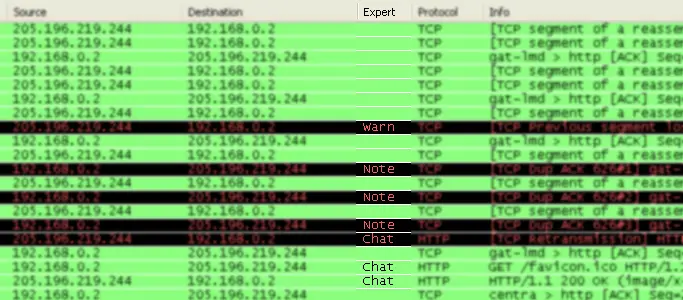
7.3.4. "Expert" Packet List Column (optional)
An optional "Expert Info Severity" packet list column
is available (since SVN 22387 -> 0.99.7), that displays
the most significant severity of a packet, or stays empty if
everything seems ok. This column is not displayed by default,
but can be easily added using the Preferences Columns page
described in
Section 9.5, “Preferences”.
Published under the terms fo the GNU General Public License


![[Warning]](wsug_graphics/warning.png)
![[Note]](wsug_graphics/note.png)