Tracing Tab
The Tracing Tab allows you to put the platform in debug mode and enable tracing which results in debug statements printed to the console.
Tracing
The platform provides a mechanism for tracking the activity of your plug-in at runtime. It allows you to use tracing flags that will cause tracing information to be printed to the console.
These flags are defined in .options files. These properties files must be located at the root of a plug-in and must have the following syntax:
- <plug-in ID>/debug = true/false (master switch)
- <plug-in ID>/<tracing flag> = <value>
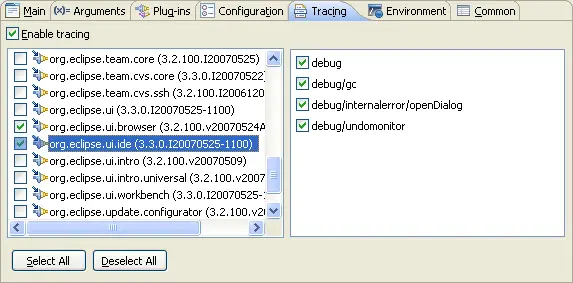
For example, the org.eclipse.ui.ide plug-in selected above has a .options file that contains three key-value pairs:
-
org.eclipse.ui.ide/debug = true
-
org.eclipse.ui.ide/debug/gc = true
-
org.eclipse.ui.ide/debug/internalerror/openDialog = true
In your code, to check if your plug-in is in debug mode (i.e. state of the master switch), you can check the return value of <Activator>.isDebugging(), where <Activator> is the class specified in the Bundle-Activator header of your plug-in's MANIFEST.MF file.
Values for individual flag names can be obtained by calling Platform.getDebugOption(optionName).
Enable Tracing
When the Enable tracing for the selected plug-ins option is checked, PDE launches with the -debug <filename> program argument. The <filename> portion of the program argument is a properties file generated by PDE that contains both key-value pairs for the plug-ins you are tracing and the state of each tracing flag.
Please note that toggling tracing flags on the Tracing tab does not result in the modification of the .options file. The tracing flag values are saved as metadata in the launch configuration itself and are copied into the master properties file that is passed to the runtime via the -debug argument.


