Launch a MIDlet in debug mode
In this section, you will learn more about debugging Java ME MIDlets in
the workbench.
The following is assumed:
- You configured the Java debugging options
- You are familiar with debugging your Java programs in Eclipse.
If you did not configured the Java debugging options, please see the PreparingEclipse section of this User Guide.
Using the "Debug As" context menu item
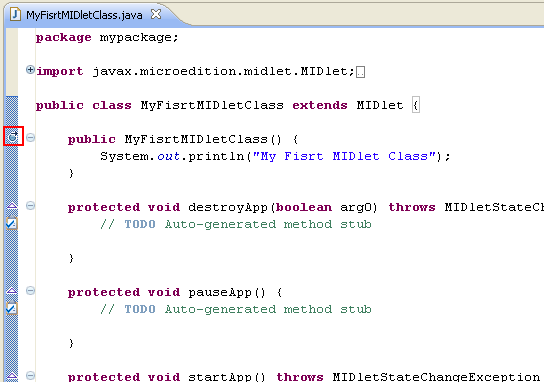
- In the Package Explorer view, find the main MIDlet class and
double-click it to open it in the java editor.
- Place your cursor on the vertical ruler along the left edge of the
editor area on the class constructor and double-click on the ruler to set a
breakpoint.
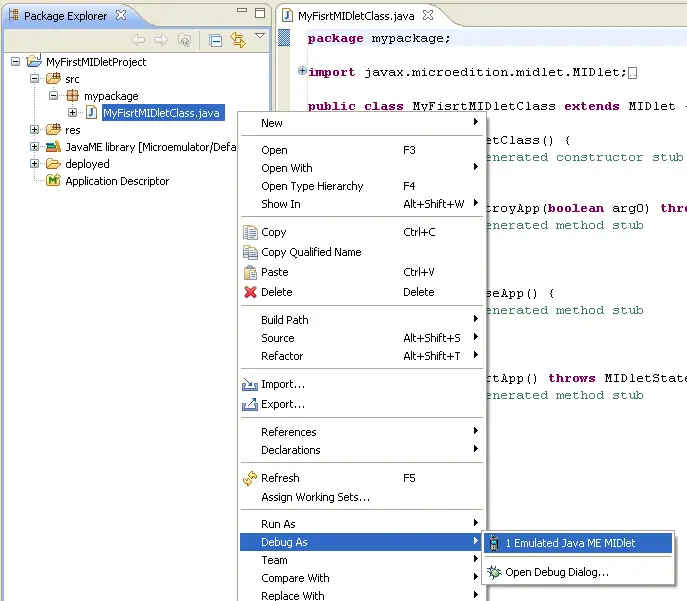
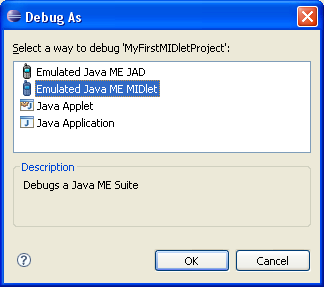
- Right click on the main MIDlet class in the Package Explorer and
select Debug As > Emulated Java ME MIDlet. This will launch
the selected class in debug mode using the Java ME SDK device previously
configured for use in the MIDlet project. The Debug As context
menu item is also available in other places, such as the Outline view and the
Java editor.
- A configuration is automatically created to launch the MIDlet in debug
mode.
- The program will run until the breakpoint is reached. When the
breakpoint is hit, execution is suspended, and you are asked whether to open
the Debug perspective. Click Yes and start debugging.
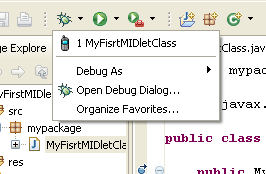
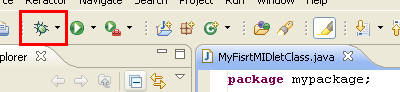
Using the Debug button from the workbench toolbar
- Add at least one breakpoint to your classes.
-
Click on the debug button from the workbench toolbar, which will launch
the currently selected resource or active editor in debug mode.
-
If prompted, select the Emulated Java ME MIDlet option.
- A configuration is automatically created to launch the MIDlet in debug
mode.
- The program will run until the breakpoint is reached. When the
breakpoint is hit, execution is suspended, and you are asked whether to open
the Debug perspective. Click Yes and start debugging.
Through the Application Descriptor overview page
- Add at least one breakpoint to your classes.
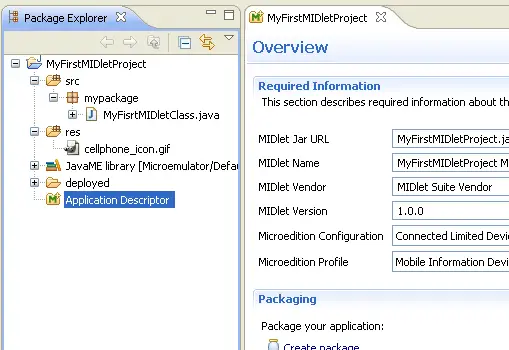
- In the Package Explorer view, find the Application Descriptor file and
double-click it to open it in the java editor.
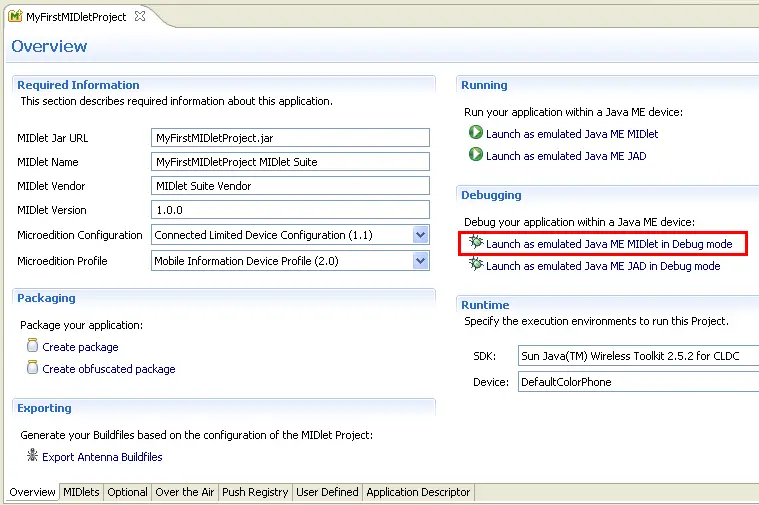
- On the Debugging section, click on the Launch
as emulated Java ME MIDlet in Debug mode.
- A configuration is automatically created to launch the MIDlet in debug
mode.
- The program will run until the breakpoint is reached. When the
breakpoint is hit, execution is suspended, and you are asked whether to open
the Debug perspective. Click Yes and start debugging.
Manually creating the configuration to launch the MIDlet in debug mode
href="eclipse_java_me_javascript:executeCommand("org.eclipse.debug.ui.commands.OpenDebugConfigurations")">  Run > Open Debug Dialog... from the workbench menu bar. This opens a
dialog that lets you create, modify, and delete launch configurations of
different types.
Run > Open Debug Dialog... from the workbench menu bar. This opens a
dialog that lets you create, modify, and delete launch configurations of
different types.
- Select Wireless Toolkit Emulation in the left hand
list of launch configuration types, and press the New button
in the toolbar. This will create a new launch configuration for your MIDlet
Project. The tabs on the right hand side allow you control specific
aspects of the launch.
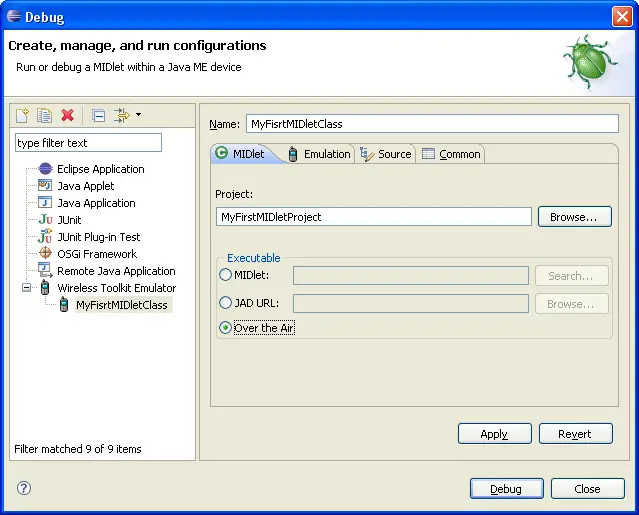
By default, the configuration is created for Over The
Air debugging. See here
for more details on the different launch modes.
Debugging Signed MIDlets
Under normal circumstances, when you select a non-OTA launch, MTJ
attempts to run the emulator using the classes in the verified area, rather than
performing a full deployment. Certain emulators will not operate in this mode,
and require your project to be fully deployed. In addition, OTA launches also
require a full deployment operation be performed.
MTJ handles all these details automatically. However, as a result, if you
have configured your MIDlet to be signed, the signature operation is part of the
deployment process. As such, depending on your signature password settings, MTJ
may need to prompt you for the keystore and key passwords as part of doing the
launch. This is most likely to happen the first time you attempt to launch when
you have configured MTJ to prompt for passwords. Thereafter, until you close
Eclipse or change the workspace, MTJ will store the passwords in memory, and
thus will not have to re-prompt you.


