Follow Techotopia on Twitter

On-line Guides
All Guides
eBook Store
iOS / Android
Linux for Beginners
Office Productivity
Linux Installation
Linux Security
Linux Utilities
Linux Virtualization
Linux Kernel
System/Network Admin
Programming
Scripting Languages
Development Tools
Web Development
GUI Toolkits/Desktop
Databases
Mail Systems
openSolaris
Eclipse Documentation
Techotopia.com
Virtuatopia.com
Answertopia.com

How To Guides
Virtualization
General System Admin
Linux Security
Linux Filesystems
Web Servers
Graphics & Desktop
PC Hardware
Windows
Problem Solutions
Privacy Policy


Eclipse BIRT Report Developer Guide
Previous Page Home Next Page

Previous Next

Task 5: 

In this procedure, you insert elements in the report page to display the data from the data set that you created previously. You start by inserting a table element, then you insert data elements in the table. It is important to understand the functionality that the table provides. The table:

2
Drag a table element from the palette, and drop it in the report in the layout editor. Insert Table prompts you to specify the number of columns and detail rows to create for the table. The dialog also prompts you to select a data set to bind with the table.

Figure 1-14 Table properties in Insert Table

Choose OK. A table with three columns and one detail row appears in the layout editor. Now, you are ready to insert data in the table.
5
In Data Explorer, expand Data Sets, then expand Customers. The columns that you specified in the query appear below Customers.
6
Drag CUSTOMERNAME from Data Explorer, and drop it in the first cell in the table’s detail row, as shown in Figure 1‑15. The detail row displays the main data in the report. In the finished report, the detail row repeats to display all the data rows from the data set.

Figure 1-15 Dragging a column from Data Explorer, and dropping it in a table cell

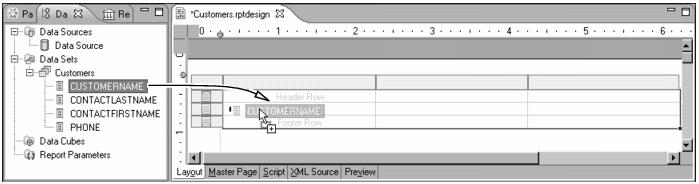
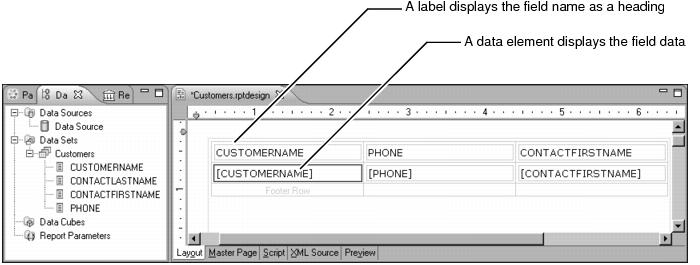
In the layout editor, the table cell in which you dropped the CUSTOMERNAME field contains a data element that displays [CUSTOMERNAME]. Above this data element is a label element that the layout editor automatically added to the header row. This label displays the field name as static text. It serves as the column heading. Figure 1‑16 shows the data and label elements.

Figure 1-16 Data and label elements in a table

9
Drag CONTACTLASTNAME, and drop it in the third cell in the detail row, below CONTACTFIRSTNAME. The report page should look like the one shown in Figure 1‑17.

Figure 1-17 Customer and contact information added to a table

10
Choose Preview, the tab at the bottom of the layout editor. BIRT Report Designer generates and displays the report in HTML format, as shown in Figure 1‑18. Scroll down to see the entire report.
As Figure 1‑18 shows, the data is correct, but it appears in random order. It makes more sense to sort the data alphabetically by customer name. The report’s appearance also needs improvement.

Figure 1-18 Preview of report data

Figure 1‑18

(c) Copyright Actuate Corporation 2009


  Published under the terms of the Eclipse Public License Version 1.0 ("EPL") Design by Interspire