Follow Techotopia on Twitter

On-line Guides
All Guides
eBook Store
iOS / Android
Linux for Beginners
Office Productivity
Linux Installation
Linux Security
Linux Utilities
Linux Virtualization
Linux Kernel
System/Network Admin
Programming
Scripting Languages
Development Tools
Web Development
GUI Toolkits/Desktop
Databases
Mail Systems
openSolaris
Eclipse Documentation
Techotopia.com
Virtuatopia.com
Answertopia.com

How To Guides
Virtualization
General System Admin
Linux Security
Linux Filesystems
Web Servers
Graphics & Desktop
PC Hardware
Windows
Problem Solutions
Privacy Policy


Eclipse BIRT Report Developer Guide
Previous Page Home Next Page

Previous Next

Task 7: 

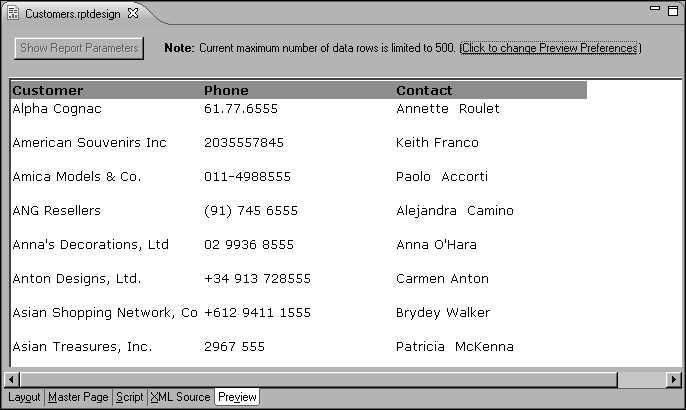
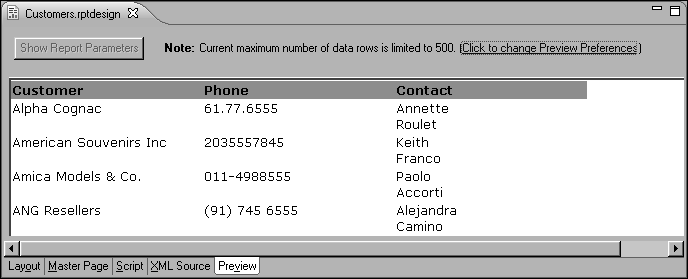
Now that you verified that the report displays the correct data in the correct order, you can turn your attention to improving the report’s appearance. You perform the following tasks in this section:

Edit the column headings

2
Double-click the first column heading, CUSTOMERNAME. The column heading is in the first row—the header row—of the table.
3
To replace all the highlighted text, start typing, then press Enter when you finish. To edit the text, click once to deselect the text, then position the cursor where you want to add or delete characters.
4
Repeat steps 2 and 3 to change the second and third column headings to the following text:

Figure 1-23 Revised column headings in a report design

Format the column headings

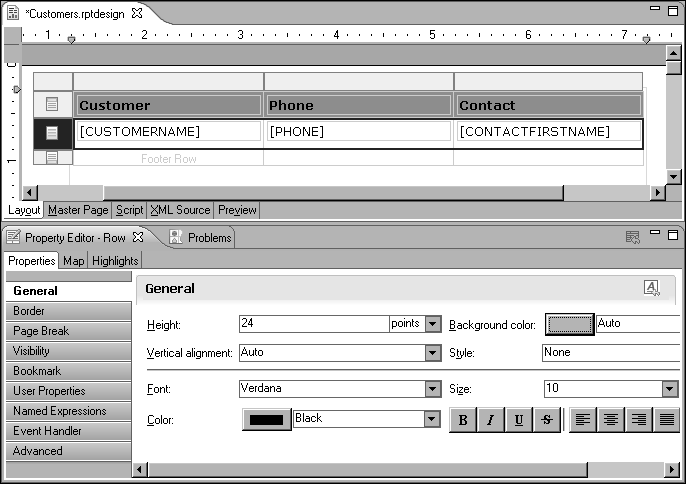
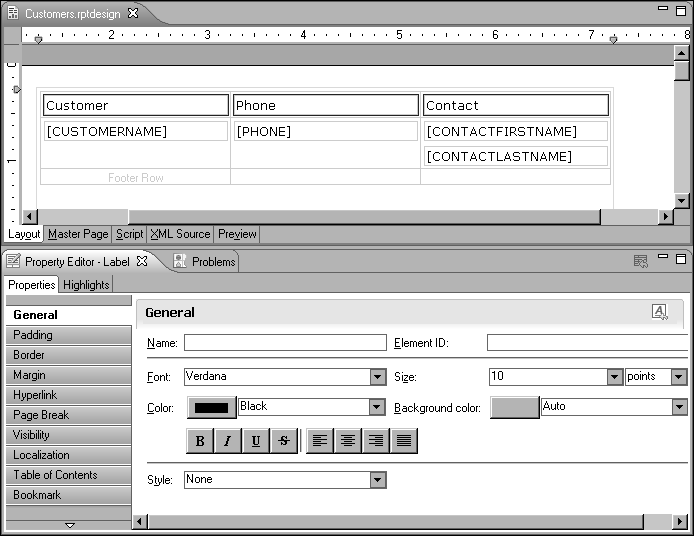
To format a report element, you set its properties. You can accomplish this task in one of the following two ways:

n
Define a style that contains the desired properties, and apply the style to an element. Use this method to define format properties once and apply them to more than one element.

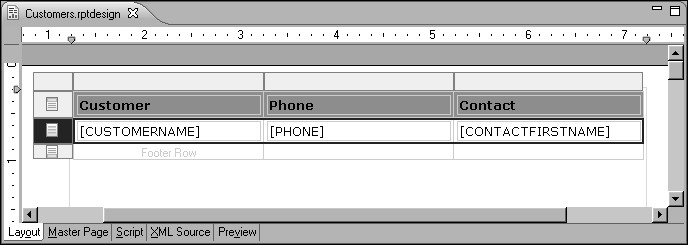
You might notice that in the report design, the column headings appear in plain text and are left-aligned. The generated HTML report, however, displays the column headings in bold and centered. This discrepancy occurs because BIRT uses the browser’s default format for items placed in a table header.

In this procedure, you use the first method to align the column headings to the left, and the second method to add color to the header row.

1
Select all the column headings. To select multiple elements, press the Shift key as you click each element. Property Editor displays the properties for the selected elements, as shown in Figure 1‑24.

Figure 1-24 Properties for selected elements in Property Editor

1
New Style appears, as shown in Figure 1‑25. The left side displays the property categories. The right side displays the properties for the category that you select.

Figure 1-25 New Style

Figure 1‑25
3
Choose Background from the list of property categories. New Style displays the background properties that you can set.
5
In the layout editor, select the table by selecting the Table tab in the lower left corner. This tab appears when you hover the mouse pointer over the lower left corner of the table. Clicking the table causes guide cells to appear at the top and left side of the table, as shown in Figure 1‑26.

Figure 1-26 Guide cells at top and left of a table

8
Apply the style that you just created by selecting table_header_row from the drop-down list next to Style. BIRT Report Designer applies the style to the header row and it appears in color.

Figure 1-27 Report preview, showing header row style

Display first and last names on the same line

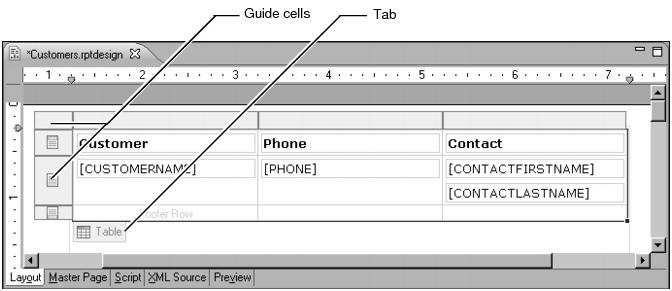
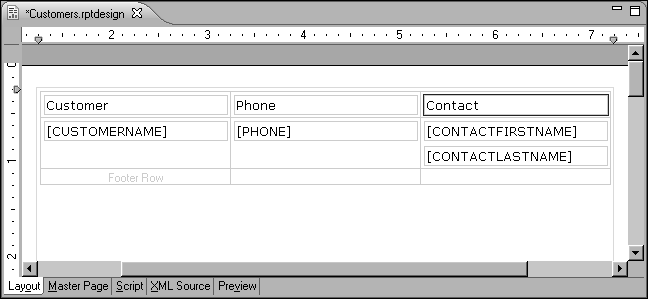
When you place multiple elements in a single cell, BIRT Report Designer creates block-level elements. If you are familiar with HTML, you know that each block element starts on a new line. To display multiple elements on the same line, you need to set them as inline elements. Alternatively, you can concatenate the first and last name values to display in a single data element, as described in this procedure.

Edit Data Binding, shown in Figure 1‑28, shows information about the data associated with the current data element. In Expression, dataSetRow["CONTACTFIRSTNAME"] indicates that the data element displays data from the CONTACTFIRSTNAME field in the data set.

Figure 1-28 Edit Data Binding

Figure 1‑28

4
Click the expression builder button next to dataSetRow["CONTACTFIRSTNAME"].
dataSetRow["CONTACTFIRSTNAME"]+" "+ dataSetRow["CONTACTLASTNAME"]
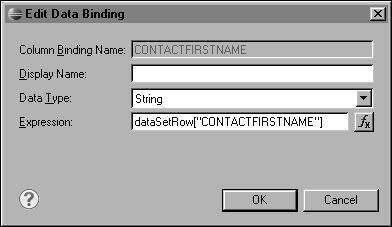
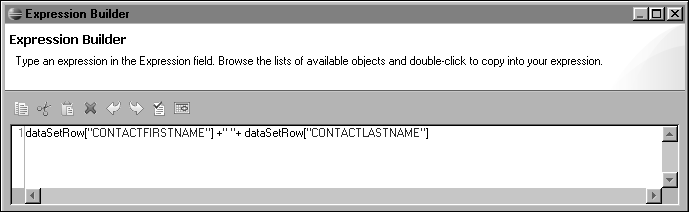
Figure 1‑29 shows this expression in the expression builder. The empty quotation marks (" ") add a space between the first name and last name. You can type the expression in the text area, as shown in Figure 1‑29, or double-click an item in the lower right of the window to insert it in the expression. 
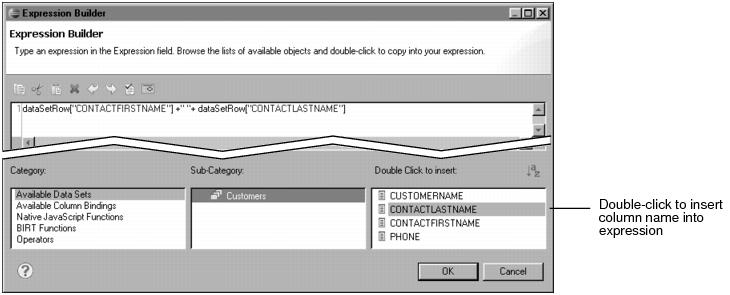
Figure 1‑30 shows a column name that you can double-click to insert into the expression.

Figure 1-29 Concatenated data in the expression builder

Figure 1-30 Concatenated data in the expression builder, created by choosing a Data Set field

Figure 1‑30

Figure 1-31 Report preview showing concatenated contact names

Increase the space between rows

The default layout adds a minimum space between table rows. Typically, you will want to adjust the spacing between rows.

Figure 1-32 Selected table row in the layout editor

Property Editor displays the properties for the row. The title that appears in Property Editor shows the type of element that you select, so you should see Property Editor—Row.

Figure 1-33 Row height set to 24 points

Figure 1-34 Report preview showing row spacing


(c) Copyright Actuate Corporation 2009


  Published under the terms of the Eclipse Public License Version 1.0 ("EPL") Design by Interspire