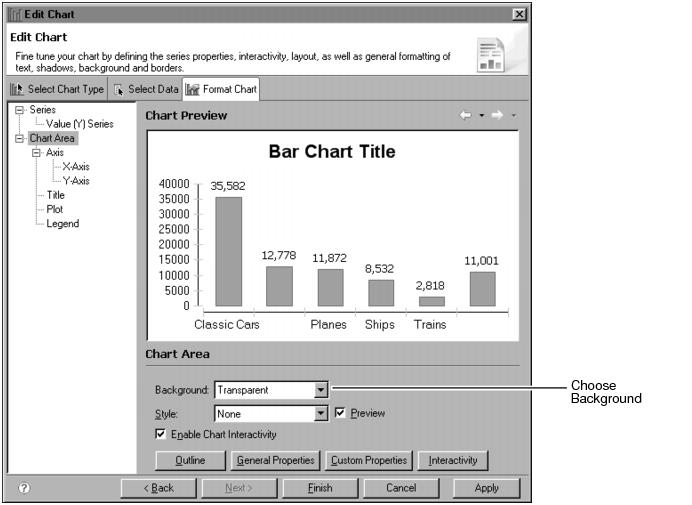
How to set a chart’s background color 1 In the chart builder, choose Format Chart, then navigate to the Chart Area section. Use the list on the left to navigate among sections. Figure 16‑2 shows the Chart Area section. Figure 16‑2 Background option in the Chart Area section 2 Choose Background to open the color picker. Figure 16‑3 shows the color picker. Figure 16‑3 Color picker 3 Use the color picker to select a background color or image as follows: n To use one of the basic colors, select a colored square. n To use a transparent background, use the Opacity scroll tool to set the opacity to 0, then press Enter. n To use a gradient color, choose Gradient, then use Gradient Editor to select a start color, end color, and rotation for the gradient pattern. Figure 16‑4 shows the gradient editor. Figure 16‑4 Setting colors and rotation for a gradient color n To use a custom color, choose Custom Color to show the custom color list, then select a color. n To use a background image, choose Image, then use Open to navigate to and select the image to use. The background color or image appears in Background on the chart builder. 4 To apply the color to the chart, choose Finish. To define a custom color, on the color picker, choose Define Custom Colors to show the custom color picker, as shown in Figure 16‑5. Figure 16‑5 Color picker including custom color options Use the color picker options to select or define a custom color. When you finish, choose Add to Custom Colors, then choose OK.
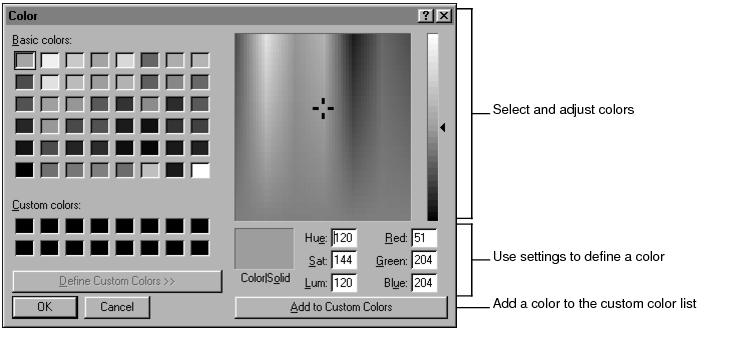
To define a custom color, on the color picker, choose Define Custom Colors to show the custom color picker, as shown in Figure 16‑5.
Use the color picker options to select or define a custom color. When you finish, choose Add to Custom Colors, then choose OK.