Some OProfile preferences can be set with a graphical interface.
To start it, execute the oprof_start
command as root at a shell prompt.
After changing any of the options, save them by clicking the
Save and quit button. The preferences are
written to /root/.oprofile/daemonrc, and
the application exits. Exiting the application does not stop
OProfile from sampling.
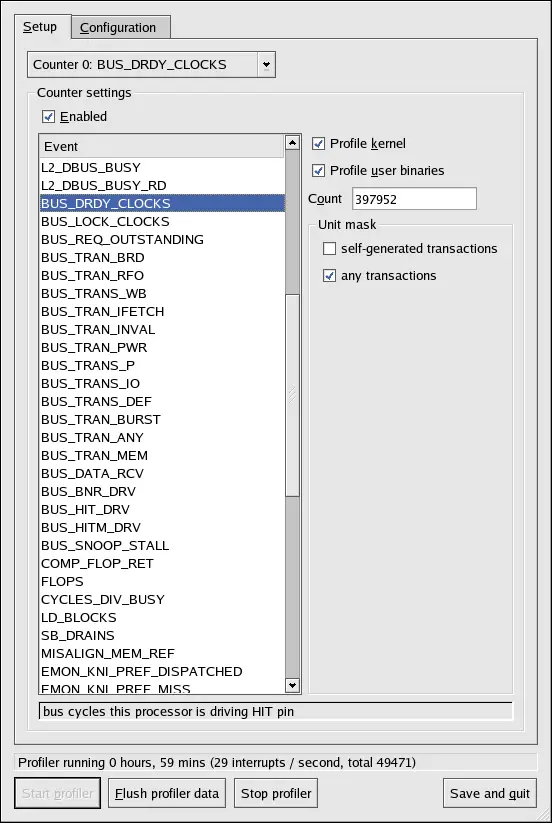
On the Setup tab, to set events for the
processor counters as discussed in Section 41.2.2
Setting Events to Monitor, select the counter from the
pulldown menu and select the event from the list. A brief
description of the event appears in the text box below the list.
Only events available for the specific counter and the specific
architecture are displayed. The interface also displays whether the
profiler is running and some brief statistics about it.
On the right side of the tab, select the Profile kernel option to count events in kernel mode
for the currently selected event, as discussed in Section
41.2.3 Separating Kernel and User-space Profiles. If
this option is unselected, no samples are collected for the
kernel.
Select the Profile user binaries option
to count events in user mode for the currently selected event, as
discussed in Section
41.2.3 Separating Kernel and User-space Profiles. If
this option is unselected, no samples are collected for user
applications.
Use the Count text field to set the
sampling rate for the currently selected event as discussed in
Section
41.2.2.1 Sampling Rate.
If any unit masks are available for the currently selected
event, as discussed in Section
41.2.2.2 Unit Masks, they are displayed in the Unit Masks area on the right side of the Setup tab. Select the checkbox beside the unit mask
to enable it for the event.
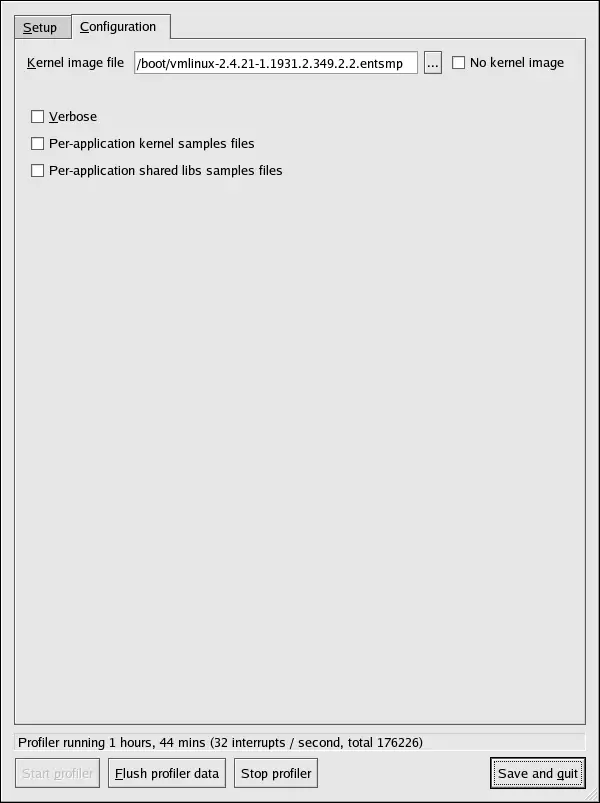
On the Configuration tab, to profile the
kernel, enter the name and location of the vmlinux file for the kernel to monitor in the
Kernel image file text field. To configure
OProfile not to monitor the kernel, select No
kernel image.
If the Verbose option is selected, the
oprofiled daemon log includes more
information.
If Per-application kernel samples files
is selected, OProfile generates per-application profiles for the
kernel and kernel modules as discussed in Section
41.2.3 Separating Kernel and User-space Profiles. This
is equivalent to the opcontrol
--separate=kernel command. If Per-application shared libs samples files is
selected, OProfile generates per-application profiles for
libraries. This is equivalent to the opcontrol
--separate=library command.
To force data to be written to samples files as discussed in
Section 41.5 Analyzing
the Data, click the Flush profiler
data button. This is equivalent to the opcontrol --dump command.
To start OProfile from the graphical interface, click Start profiler. To stop the profiler, click
Stop profiler. Exiting the application
does not stop OProfile from sampling.